2020 Book Sales Survey Results


By: Craig on January 1, 2021
When the Covid-19 pandemic first started and everyone entered their first (of many) lockdowns, many authors reported seeing an initial uptick in sales. As time wore on, however, and 2020 continued its downward spiral, I began to hear more and more about how book sales were starting to fall. While anecdotal reports are great for being alerted to an issue, it’s usually more useful to try and gather info from a wider variety of sources in order to look for trends, and with access to so many self-published authors, I’m in a unique position to do just that. So with that in mind, I sent out a recent survey to gather more hard data, and I’ve crunched the numbers on the results to try and give you an idea of just how bad things have gotten, who has been affected and to what extent.
Way back near the start of the Covid-19 Pandemic, it was actually looking like authors were one of the few professions that might actually benefit from a world forced to lock themselves at home with nothing to do but read.
I was getting emails from authors noting how sales were up, and even the number of people signing up to read free books via our ARC program was noticeably higher. At the time, this was back near the end of April 2020, I even created a short survey and sent it out to the authors on the Hidden Gems mailing list in an attempt to see how widespread the experience was.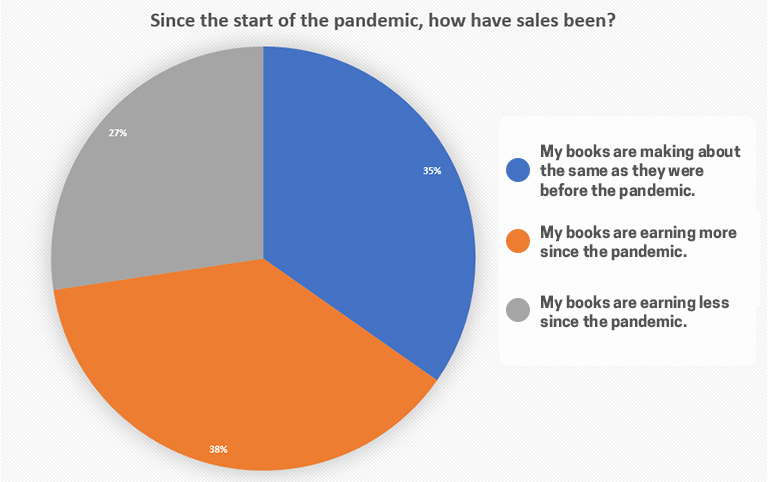
Of the 95 authors that responded, 38% reported that sales were up, and a further 35% said that sales were about the same. Only 27% were seeing a drop in their book earnings.
And while far from a scientific study, this was at least an encouraging sign and one we all hoped would continue. Unfortunately, near the end of the summer I was starting to hear a very different tale. For many authors, sales had begun to drop, sometimes drastically so, and even well promoted new releases from authors with a history of strong sales were falling flat.
Authors often talk about a summer slump, where book sales trend downward in months when readers are spending more time outdoors and with families home from school, but the dips being reported (not just to me, but I saw authors discussing it on various author forums across the web) eclipsed what was normally expected during that time, and sales didn’t start to pick up in September as they often do.
Time passed, we all waited it out, expecting things would eventually improve – certainly by the end of the year.
But have they?
Authors have recently emailed me asking whether it was safe to release the book that they were holding back on publishing, or wondering how their results compared to everyone else’s. Finding those answers was the true catalyst for creating this new survey, so let’s see how things are out there.
Caveats, Bias, Disclaimers
First, I want to be clear that I’m no expert in giving surveys or analyzing the results, but I’ve done my best to crunch the numbers from the questions I asked. Unfortunately, one of the issues with giving survey’s like this is that you don’t want to make them too long or people won’t want to fill them out, which means we can only ask so much. So there will definitely be areas it would have been ideal to dig deeper into, but hopefully I’ve asked enough to add a bit of relevancy to the results, allowing authors to better compare themselves to the overall group.
Another issue to keep in mind is that we’re limited by the number of responses we get and the overall makeup of the respondents being polled.
I sent it out to my list of over 4000 self-published authors (and tweeted about it once), but only 78 chose to fill it out this time (I did limit it to authors that have published at least 2 books, in an attempt to make sure that the authors had enough sales data to report on, so that also limited the number of possible responders).
I don’t think 78 is a bad sample size, but our list does heavily favor romance writers (although we’ll break the data out by genre when possible). And of course, self-selection bias probably plays some part here, although it’s hard to tell in what way. For instance, perhaps those that chose to fill out the survey did so because they have had poor sales and were more motivated to give their feedback than those with strong sales? Or vice versa, maybe those with strong sales over-reported to help reassure others that the problems were in the past. My hope is that we didn’t have any strong biases like that, but it’s still something to call out for you to consider when interpreting the results.
Now, although I’m doing my best to be clear that the results here aren’t going to be the most scientific and you should carefully weigh how you interpret the data, my hope is that they will at least paint a picture of what some of your peers are experiencing, and maybe that will help you a bit in figuring out your own next steps as an independent author.
If nothing else, enjoy the pretty charts I generated in excel, and try not to think about how much of a pain that was for me having never worked with pivot tables or pivot charts before. That’s why it took an extra week to put this all together.
Yes, that’s right, I suffered… for you!
Respondent Makeup
So with all that being said, let’s first look at the overall makeup of the respondents. While the survey results were anonymous, I did ask a number of questions designed to provide context into the respondent makeup. The idea is that you can use this info to help determine how similar you are to the groups reporting, as a better way to compare apples-to-apples, so to speak.
Total Number of Author Survey’s Completed: 78
Genre
The 78 authors that responded can be broken down in a number of ways, and one of the most relevant is probably genre.
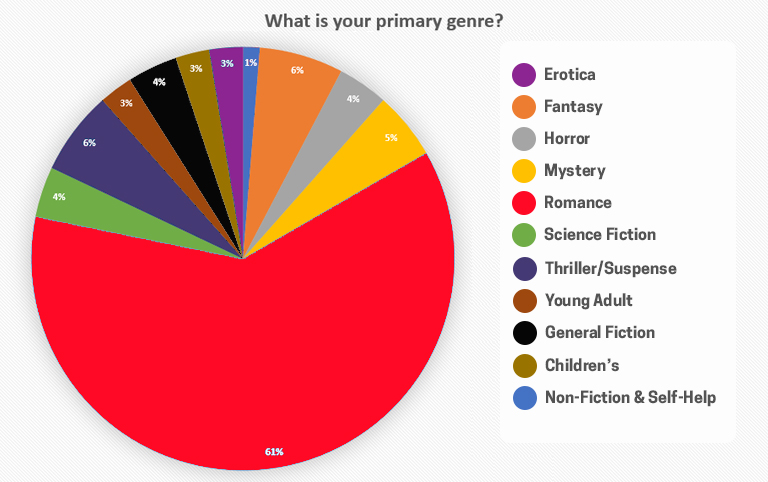
At the beginning of the survey I asked respondents to pick a single genre and report on their book sales for their books in that genre only, so as to not mix the results for those authors that write across multiple genres.
Unsurprisingly (given our roots and overall list makeup), the majority of authors identified romance as their primary genre. Not only was romance the biggest individual genre selected (48 authors out of the 78), it was also selected more than all the other genres combined. Thrillers and fantasy were tied as the next highest with 5 authors each.
Number of Books
In an effort to make it more likely that the authors would have some historical data to compare against, I limited responders to those that had published at least 2 books. Broken down, over half (43) of authors that responded have published at least 6 books.
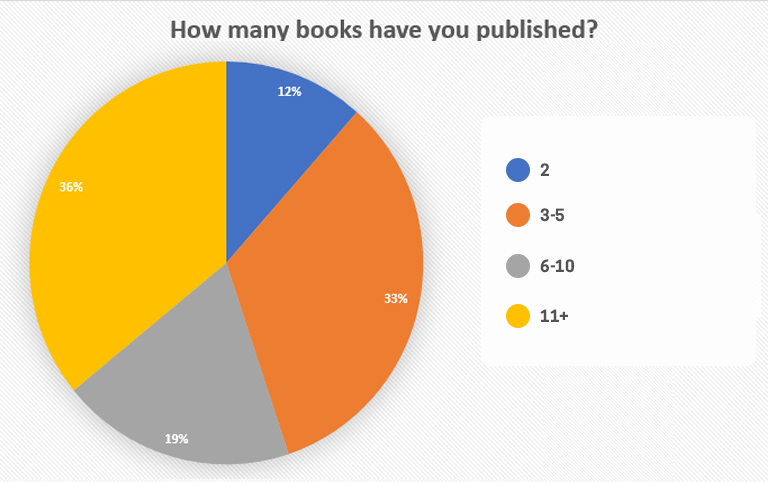
It could be that this is where a bit of selection bias came in, with authors that had published more books being more likely to fill the survey out since they knew they had the numbers to compare against. And in fact, I did hear from one author that mentioned that they didn’t feel like they had enough data to fill out the survey, so it likely was a factor for others as well. Still, I think the more data an author has to draw on, the more relevant their results will be when it comes to questions of whether they’re noticing a drop in sales or not. So in this case, I think it’s better to have the deck stacked a bit with authors that have written many books.
Wide Sales
Now, since “going wide” (publishing on multiple bookstores instead of being exclusive to Amazon) is becoming more and more popular, I thought it would be a good idea to ask where authors were selling their books. This is useful for comparison reasons, but additionally, asking this will allow us to dig in to see if any potential issues are specific to certain storefronts or if they are more industry wide.
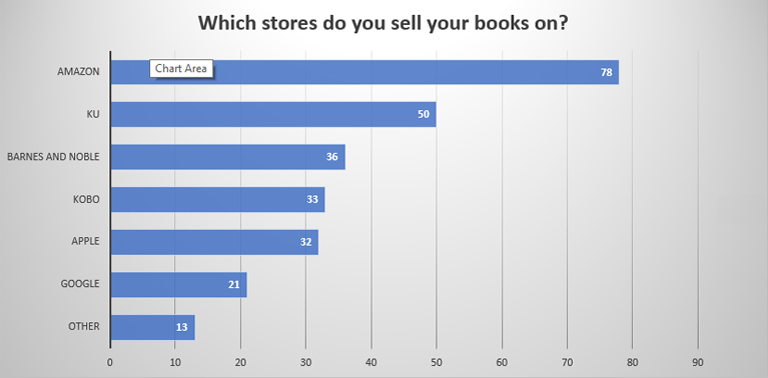
Authors were able to select all the stores that they sell on, which is why the numbers here add up to a lot more than 78. As expected, every author sells on Amazon, and about 64% of them use KU (Kindle Unlimited).
And while KU is exclusive, eagle-eyed readers may wonder how it could be, then, that out of 78 responders, 50 are in KU which would mean only 28 could be on other storefronts, yet many of those other storefronts report more than 28. That’s no error, it just means that some authors are taking a mixed approach. KU is exclusive per book, not per author or catalog, so some authors use KU for some books, meaning those are exclusive, but are wide (and thus not in KU) for other books.
We can break these numbers down into four categories that an author falls into, which I’ll define here for use later:
Amazon: 6% (5 authors)
Author sells books on Amazon only, and does not use KU.
KU: 46% (36 authors)
Author sells only on Amazon and has at least some books enrolled in KU, (those that are in KU and publish on non-Amazon stores as well are included in the “Mixed” group below).
Wide: 29% (23 authors)
Author publishes wide, on multiple bookstores and is NOT enrolled in KU (so likely they publish all their books on the various stores, but we don’t know that for sure).
Mixed: 18% (14 authors)
Author publishes wide, on multiple bookstores, and IS enrolled in KU, which means that some books are exclusive to Amazon and some are not.
Monthly Earnings
The last question I asked for the purposes of author demographics was in regards to earnings. Simply asking something vague about “success” isn’t very meaningful since each author probably has a different definition of the word, so I asked responders to note how much their books earn in an average month.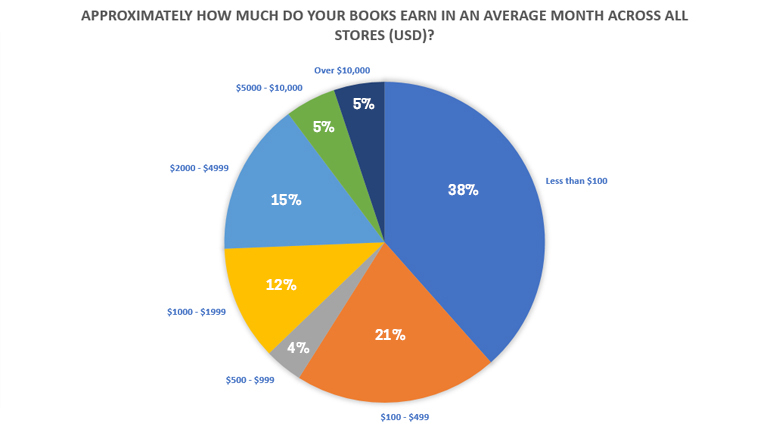
Of course, to add more context (when compared to your own situation) it is more helpful to break this down by genre.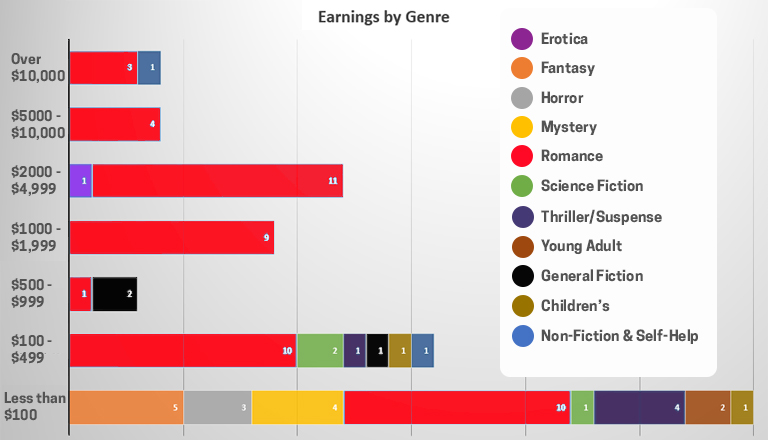
With the exception of one non-fiction/self help author doing very well, most of the big money seems to be coming from romance, although given the majority of responders writing in that genre, it could just be a selection bias. Still though, most studies I’ve seen have said that romance is one of the most popular book genres, and these results do tend to support that.
But genre isn’t the only interesting way to break these numbers down. Another way to provide context, not to mention give some insight into how the various wide strategies work, is by breaking down the earnings by where the author is selling the books (using the 4 groups I defined above).
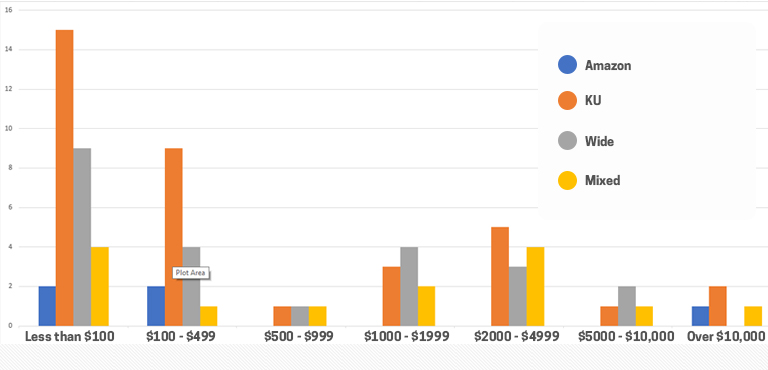
Unfortunately, with such a small dataset (especially when broken down into these 4 groups), it’s hard to really draw broad conclusions with this, but hopefully some authors will still find it useful.
But perhaps an even more important question can be answered later, once we see the results of our questions regarding the changes in sales during the two time periods we ask about. That is, are authors across the earning spectrum affected the same way, or would an author earning $100 a month be affected differently than an author that normally earns $10,000 a month?
The Results
Now that we know a bit about who the authors were that filled this survey out, let’s look at the results in terms of the questions we were really looking to answer. Mainly, did the author see a noticeable change in sales around mid-late summer 2020 (around when authors were starting to report a big drop) and if so, by how much and did they do anything to try and mitigate it?
And then, how are more recent sales?
Summer sales
So first up, did the author notice any change in their sales this past summer?
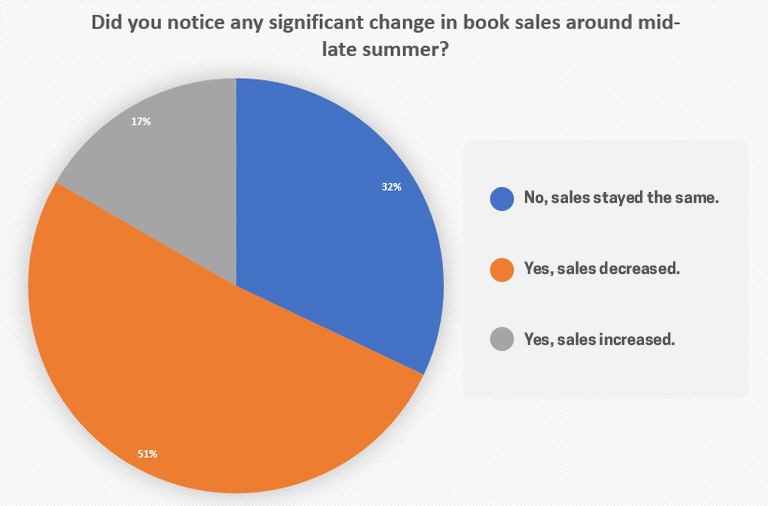
Turns out, the majority of responders (51%) saw a decrease in sales during that time, and a further 32% saw no change, leaving only 17% that saw an increase in sales.
Remember the April survey I cited at the beginning of this blog? In that one, 38% were seeing an increase in sales and only 27% were seeing a decrease.
So authors were seeing a drop this past summer, but how much of a change were they seeing (good or bad)?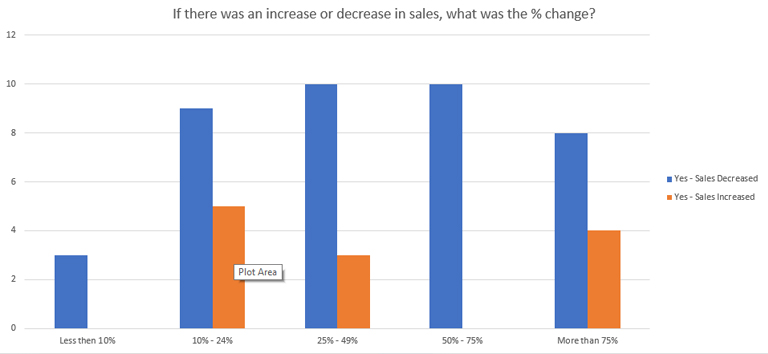
Well, I did ask about “significant” changes, so it’s no surprise that most reported a greater than 10% change, whether they were up or down. But the most affected were authors whose sales were down, with 70% of those seeing dips in their sales of 25% or more. That seems pretty significant.
Did you do anything to compensate?
When sales start to dip, the normal reaction for many authors is to change their advertising and marketing strategies to compensate. My feeling is that there are two main strategies here and which one you use is likely dependent on whether you attribute the drop in sales to internal or external factors.
By internal, I mean that you believe that the drop in sales is likely to do with something you’re doing (or not doing) and it can be fixed by correcting those issues. For example, maybe you’re not advertising or marketing enough, or doing it in the wrong places, or using the wrong keywords, or targeting the wrong audience.
In this case, the best approach is often to change your marketing strategies and/or increase your spend to try to improve your sales.
By external, I mean that you believe that your sales issues are outside of your control. Maybe the book is old and the decline in sales is expected, or maybe there is a global economic crisis or pandemic causing chaos in the world and leading to people having less time to read or money to buy books… (Of course, in hindsight that may seem like an obvious factor, but don’t forget that these questions were referring to sales this past summer, after a lot of these authors may have seen that initial uptick in sales in April. If that was the case, it may have not been as obvious to believe that the same factors that led to that rise were now the cause of the dip.)
In the external case, the best strategy is often to decrease or completely stop your ad and marketing spend since continuing is likely going to lead to throwing even more money away.
That was my thought process around this next question and the four possible responses, where I asked what the results were from authors whose sales had decreased and had changed their marketing tactics to compensate.
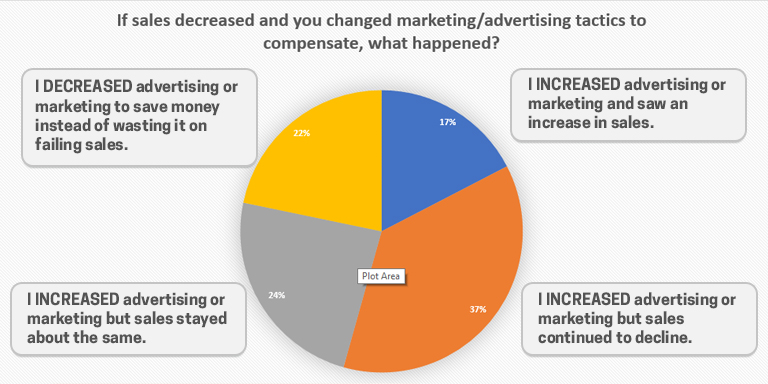
Unfortunately, this chart shows a lot of wasted money.
Not only did 37% of authors increase their ad spend only to see sales continue to fall, but a further 24% increased spending only to see sales stay the same which is also a waste of money (although harder to quantify since if they had NOT increased spending, would sales have fallen further? If not then it was definitely a waste of money, but if so then we still don’t know since we would then have to compare the difference between the drop in sales and the increased ad spend).
Only 17% increased ad spend and saw an increase in sales, with the remaining 22% saving money by decreasing their ad spend instead of continuing to throw good money after bad.
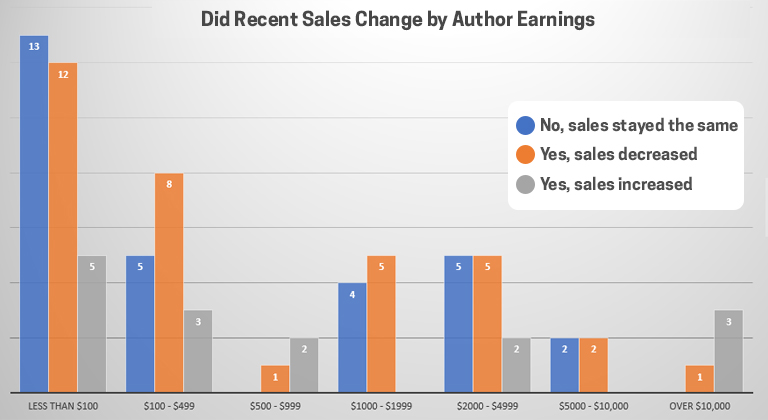
Recent Sales
Now we can turn to the final question of whether sales have changed recently, within the last month or two, and if so by how much.
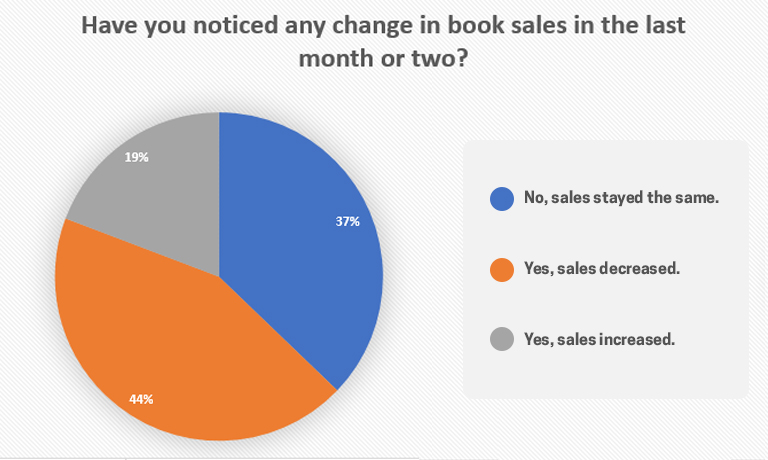
As you can see, the results on this chart largely mirrors our same question about the summer, although the results aren’t quite as bad. In this case, 44% of authors are seeing sales continuing to slide (as opposed to 51% in the summer question), but there was only a 2% increase in the number of authors reporting rising sales (19% vs 17%). The remainder reported no change.
One thing this chart doesn’t tell us is if these authors are the same ones reporting the slide in the summer (meaning they are continuing to fall) or if the makeup has radically changed. Given the similarity in numbers and the small dataset in general, I suspect that roughly the same groups are having the same issues across both time periods. (I still would have liked to chart that info, but I honestly couldn’t figure out how to graph those two things together – this is where my limited abilities with pivot tables and charts failed me.)
In terms of how much of a change these authors were seeing, that is a bit more positive.
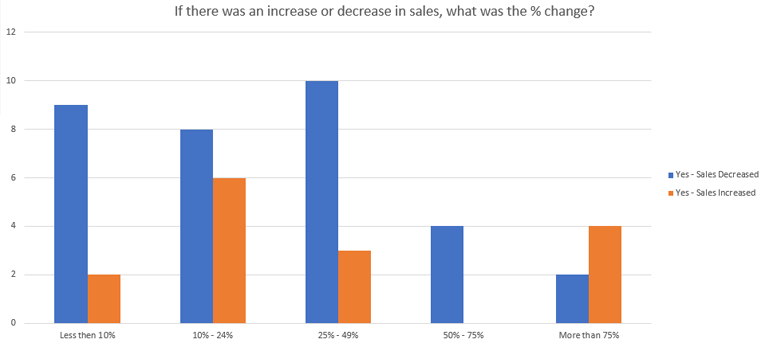
It looks like the percentage drop for those with decreasing sales is clustered around the lower end this time, as opposed to the higher end we saw in the summer chart. Although that’s also true of the authors who were seeing increasing sales.
My interpretation of this is that sales are slowly starting to improve. The drops are getting less severe, and while the gains aren’t as big, more authors were reporting improvement overall.
Sales changes across bookstore categories
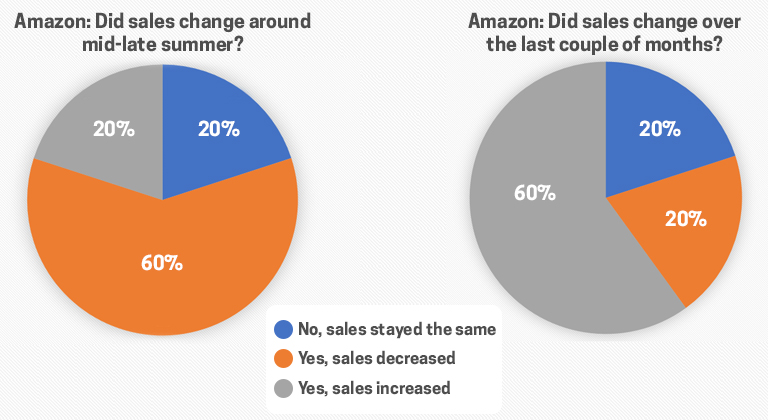
For authors that are already “wide” or even considering going wide and selling their books across multiple storefronts, it might be useful to look at whether those different strategies made any difference among survey responders. To that end, the following charts break down the question of sales change by each of the four bookstore categories I defined earlier.
Bookstore Sales Category: Amazon (sample size: 5)
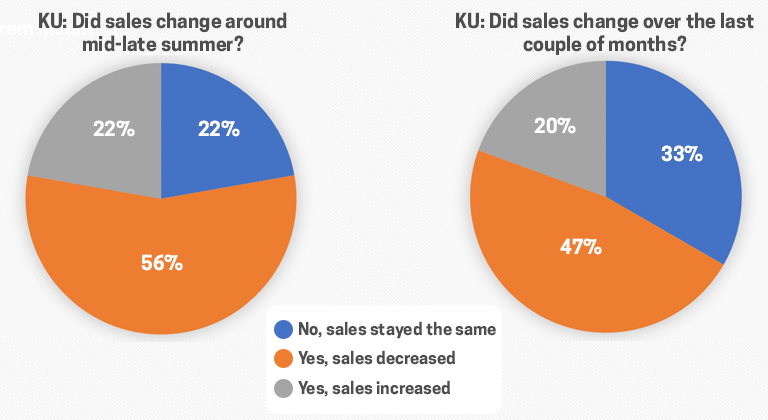
Bookstore Sales Category: KU (sample size: 36)
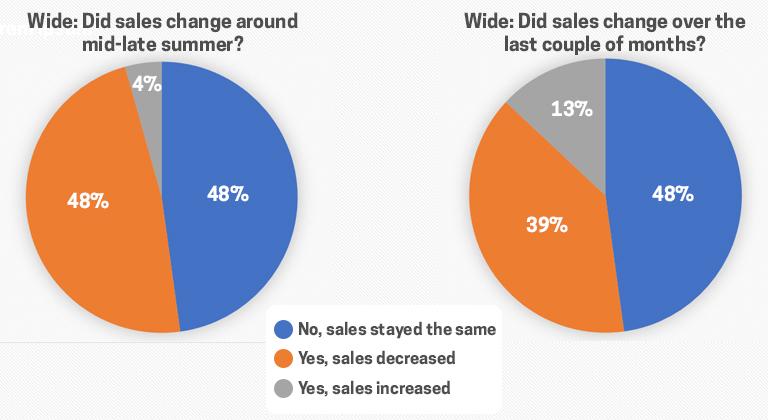
Bookstore Sales Category: Wide (sample size: 23)
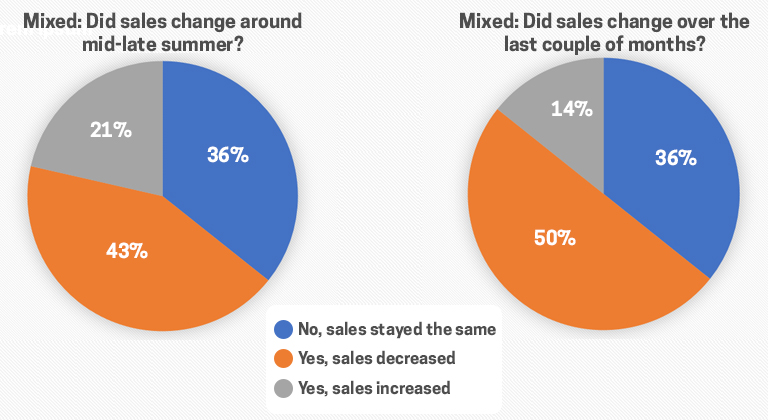
Bookstore Sales Category: Mixed (sample size: 14)
For the most part, these charts are fairly similar but note the sample sizes, specifically for the Amazon only authors. At first glance it looks like that first group is having widely greater success over the others, with recent sales increasing for 60% of the authors, but that just means three authors are seeing an increase out of the five. With that small a group, it’s very hard to know how trustworthy the numbers are. Each of those three represent 20% of the total, so a single outlier can make a big impact on this small a dataset.
Another interesting thing to note is that fewer authors reported falling sales in recent months vs the summer in all of the groups except for the Mixed group. That group also reported less sales increases in the last couple of months with the other groups showing an increase or almost flat.
Hard to say why that would be, although one possibility would be that Mixed authors pay a penalty by splitting their audiences across storefronts, with some books being exclusive to Amazon and some sold elsewhere. This makes it harder to benefit from a big fan base, and rabid fans that want to read your whole catalog is how big authors get bigger and insulate themselves against lean times. If a fan that only buys books from Apple can’t purchase a portion of your catalog because they’re exclusive to Amazon, those are lost sales. And I would wager that when readers are being more selective about the books they buy, they are more likely to spend their time and money reading authors that they already know and like than taking a risk on someone new.
Sales changes across normal monthly earnings
The final data point I want to look at before wrapping up, is whether the sales changes affected authors equally across the spectrum of monthly author earnings. To do that, we’ll look at how both summer and recent sales changes are broken down across author earning brackets.
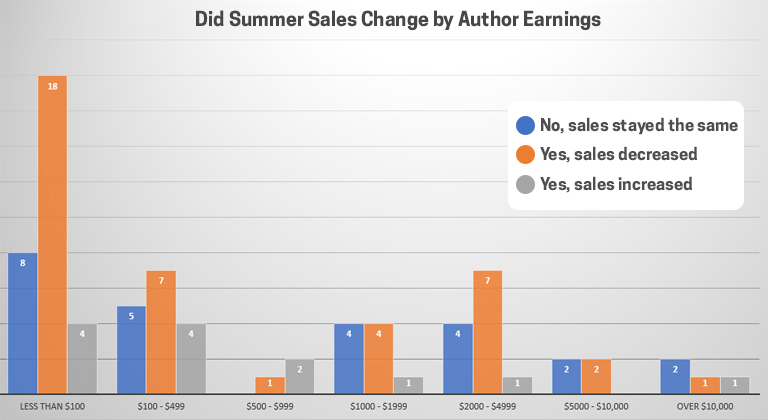
 The important thing to pay attention to here isn’t the size of the bars in each section vs the others, as the bar height is only determined by how many authors were in each earning bracket. We had more authors reporting that they earn less than $100 a month than any other group, so those bars will naturally be higher than the bars of the other brackets. The more important thing to look at is the distribution of the 3 colors within each earnings bracket. Within each group, which ones had the higher percentages of authors reporting decreases or increases in earnings? Once you look at that, you can then compare those percentages to the other groups to see if any groups did better or worse.
It’s a bit hard to tell from those charts, so I created two others. These show you the percentages of each group that saw a decrease or an increase in the two sales time periods.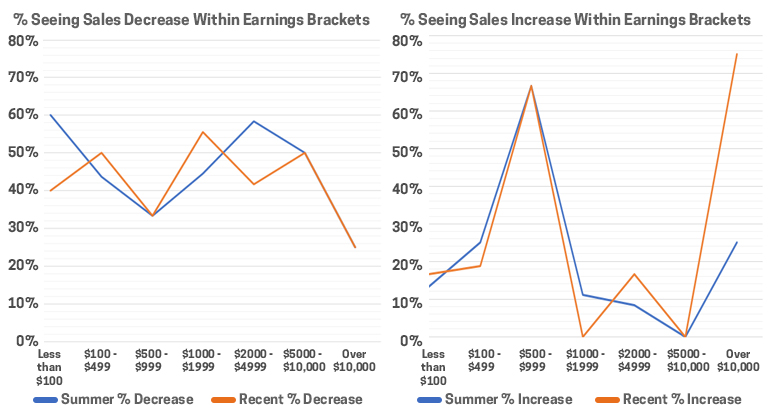
This makes it a bit easier to see. Across either time period, the percentage of authors reporting a decrease was relatively stable between about 40-60% with a couple anomalies of both the $500-$999 group and the Over $10,000 group. But it’s also important to note that both of those groups had small sample sizes (3 and 4, respectively), which means their numbers are more prone to outliers throwing them off.
Similarly, when we look at the percentage of authors reporting an increase, the trends across both timelines are similar with most earning brackets having less than 30% of respondents reporting increases aside from those same two outlier groups.
So what does all this tell us?
Hard to say, to be honest. Again, because the sample size, especially from those two groups, are so small they are hard to rely on. For instance, it’s easy to imagine selection bias in authors earning over 10k and seeing recent sales improvements wanting to share their results, vs those with poor recent performance not wanting to talk about it (even anonymously).
And the $500-$999 group didn’t change at all between time periods, two authors had increases both times, one author had a decrease.
With more data, we could draw more conclusions. For instance, if we had more data on the 10k group and the overall percentages were similar, we could guess as to why that was. Authors that earn that much likely have bigger catalogs better suited to weathering the storm of poor sales periods, at least in the short term. Or it could be that they have a larger fan base to draw on, in order to drum up sales on new releases instead of being at the whim of the overall market. Or maybe they’re better at marketing and advertising because they have more experience.
Those are actually results I would have expected to see (authors with larger monthly earnings seeing less of a negative change overall) and the reasons why, so despite the small sample size it wouldn’t surprise me to find out that those percentages would hold even if we had more data. But given the numbers we do have, it’s impossible to say with any degree of confidence.
Wrapup and Analysis
I’m not sure whether any of these results have provided a definitive answer on anything, to anyone, except perhaps to reassure those that are seeing lagging sales that they are definitely not alone.
Overall, the numbers seem to indicate that things are improving, slowly, since the summer, but they are far from “back to normal” (at least when it comes to authors that responded to this survey). And while I admit that the overall sample size isn’t huge, and there are various selection (and other) biases potentially at play, I don’t believe that these results are all complete outliers. I’ve still been hearing about poor sales anecdotally and on various forums, and it isn’t hard to imagine the reasons why.
The worldwide pandemic hit everyone hard, and not just in terms of their health. Economically, people are suffering across the world, whether it’s because they lost their jobs permanently or temporarily. On top of that, many households with families are more pressed for time than ever before, with children being home schooled or just being home more often and needing to be entertained, taught, or just reassured and loved.
This has led to less time and money to spend on books, especially when many already had existing things like subscriptions to streaming services that have recently started to pump out extra content to a more captive audience. It may be harder to justify buying new books if money is tight, when you already get fresh content for the monthly price you’re already paying to Netflix or Disney. Not to mention that same subscription can entertain the entire family for the same price, but in an average family of four, how often does everyone (or even two or three) read the same book? Rarely, I would wager.
Yet, my feeling is that there is still more to the story than the economics of it, otherwise you would have seen KU authors seeing more of a rise in sales, or at least, less of a hit. Like Netflix, Kindle Unlimited subscribers don’t have to pay any more than before and still have access to plenty of content. So why haven’t page reads made up for lost sales?
I think it’s the same reason that Hidden Gem’s own ARC service has seen a dip in book sign-ups lately. We still have the same number of subscribers, more, perhaps, as we continue to get new ones each day. But the number of people signing up to actually read the books–across all genres–has been down over the last few months. Remember, these are free books to them, they don’t even have to pay $10 a month for a KU subscription, so why would they all of a sudden be reading less if the issue were mere economics? If anything, sign-ups should be higher because avid readers with less money would be even more desperate for content.
Here’s my theory, which you are free to agree or disagree with as you please.
Books represent a far greater mental commitment to people than sitting in front of the television and binging the latest season of the Mandalorian or whatever new baking competition is trending on Netflix. There is a lot more involved mentally by reading a book than by watching TV, and with so much going on in the world these days, I have a feeling that people are just mentally exhausted.
Even without Covid-19, 2020 would have been a year on fire, but the pandemic seemed to magnify almost every issue. We were worried about our health, about our jobs, about our families, about our future… we were terrified of leaving our house, and at the same time clawing at the walls to get out. Every time we turned on the news it seemed like there was some new catastrophe, something else to lose sleep over. With so much distraction going on in the world, with so much to think about, worry about and stress over, is it any wonder that at the end of the day, most people may just want to “turn off their brains”?
Anyway, that’s just my theory, and it’s impossible to determine whether it’s really the cause (or even a big factor) in the recent drop in book sales. Either way though, I firmly believe that things will eventually improve. The vaccines will get a handle on the virus, the US will eventually have a transition of power and regain some stability, people will be able to go outside again, the mental exhaustion will wane.
And then they’ll get back to reading books.
Share this blog
Craig Tuch began his own self-publishing career back in 2012, writing numerous bestselling romance novels under a variety of pen names, but has always recognized that he would never have been as successful if he hadn’t also been a part of a strong online community of authors. Through this community he not only became a better writer, but also learned what it took to get readers to discover him in the first place – because it’s not enough to simply write a great book, a self-publisher has to also master the packaging, promotion and marketing of their work. It was from this experience that he founded Hidden Gems, which he continues to run to this day with the goal of providing information and services designed to help authors spend more time writing books and less time worrying about all that other stuff.


Thanks for all the work you put into this, and you make some very astute points regarding sample size and the inferences that can be drawn from the information. That being said, it does point out some interesting trends.
Many thanks for analysing all the data. It was indeed a big effort on your side to help all authors out there that are most of the time confused as to why their sales are fluctuating. It is extremely frustrating. To all what you have mentioned as potential reasons for the slump, is there possibly a recent change in the AMZ algo that favored giving more visibility to higher earning authors/books in each genre on the expense of lower earning ones in an attempt to maximize the sales of AMZ in what could be the last period of covid as vaccines are rolling out and there is a business prediction that things will get back to normal. So let’s milk the cow to the max with our high earner authors/books now and we will go back to giving fair visibility to all authors when covid disappears… Because I see the slump in the charts affecting mostly low earners. Thanks again for the effort you’ve put in this survey!
Thanks for putting this together – interesting and thought-provoking.
Thank you so much for taking the time to create this survey and publish the results. It’s seems there’s hope at the end of the tunnel.
An informative and enlightening survey. I couldn’t agree more with your theory as outlined in the last four paragraphs. Thank you for putting your time and effort into assembling this information. I really appreciate it.